Website Performance Case Study: Reel Rock Tour
Today I got an email from Reel Rock Tour that they had a new website. Since I like both websites and rock climbing, of course I was super excited! If you haven’t ever seen one of their films, or don’t know much about climbing, you should totally watch any or all of them; they’re fantastic.
Anyways, I hit the new site, and BAM, it’s beautiful. Full page background pictures of mountains and Daniel Woods crushing some boulder, what could be better. Well, the background started do its carousel thing, and then there was jank, lots of jank. Jank!? What’s jank?
Jank
Jank is the opposite of smooth. Jerky. Jank comes from low framerates. What’s a framerate?
Framerate
Framerate, typically measured in frames per second (FPS), is exactly what it sounds like in English; the number of frames (snapshots) your browser can display every second. Jank is most noticeable when the framerate dips under 30 FPS. The unofficial yet agreed upon target framerate for the web is 60 FPS. If your website hits this goal, people will be all, “Wow that website is so buttery!”.
Chrome Dev Tools
Anyhow, I thought it would be fun to do a little investigation into the cause of the jank. And there’s hardly a better tool than Chrome Dev Tools. Firing up the website in question reelrocktour.com in a new Incongnito Tab (to get the purest test results) and opening up Dev Tools, we’ll first check out the Timeline.
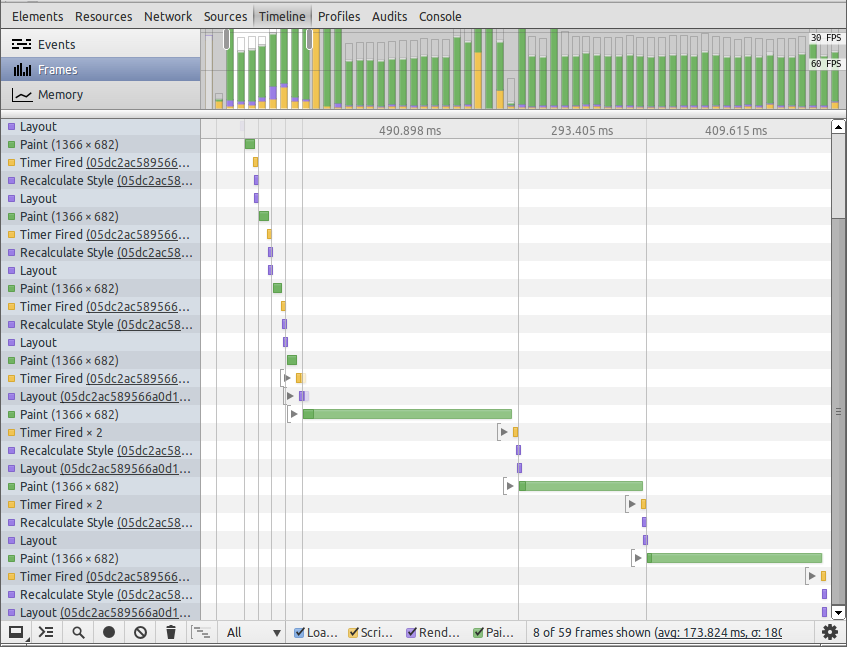
Using the Timeline in Dev Tools makes me feel like I’m in an engineering lab using an oscilliscope probing some digital circuit, and I like that. So I recorded the site, and let the background carousel scroll, and this is what it looks like.

So on the top part, the bar chart shows lots of big green segments (paints) and all of them are above the 60 FPS line, and quite a few are above the 30 FPS line. That means the target 60 FPS is not being hit. But this just confirms what we already know. On the left, you can see a list of the events, and next to the ones that say paint, it gives the pixel dimensions of what was painted, in this case, (1366 x 682), which is my entire browser window. That’s a lot of work for the browser to do.
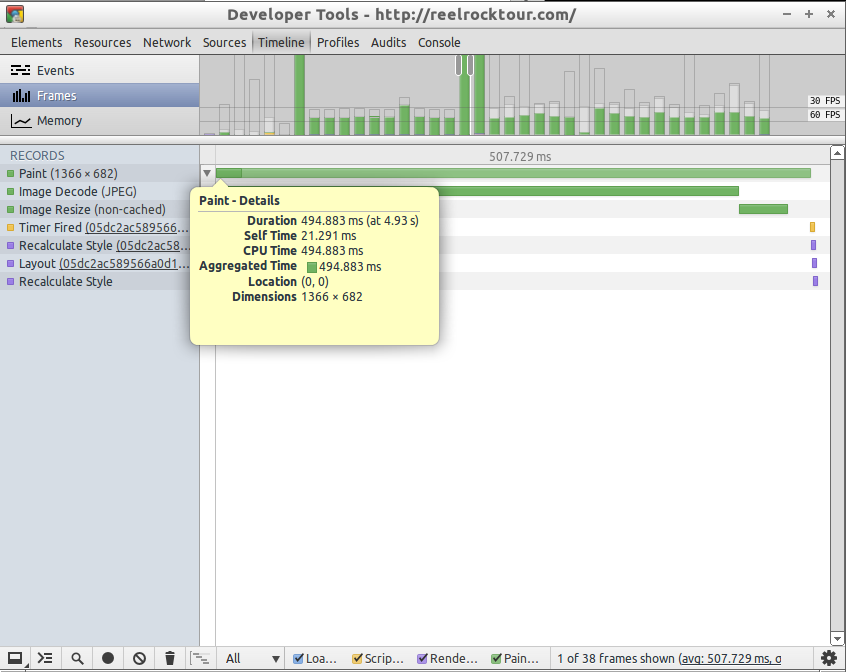
To get a better idea of why the paint is taking so long, you can zoom in on the timeline and focus on one of those huge paint times. Now we can see the details of what has to happen for that paint (which reminds of single-shot mode on an oscilliscope).

As you can see that paint takes about 230ms. If we were trying to do 60 FPS, we want any event to happen in about 16.7ms (1/60). Major problemo. We can see the a large portion of that paint is taken up by an image decode. Something to explore in a second, but one more thing to notice. There seems to be a repeating pattern of Paint -> Timer Fired -> Recalculate Style -> Layout. This, if I’m not mistaken, is typically called layout thrashing. In a few words, this means that the browser has to constantly compute the styles of affected elements, figure out their layout on the page, and paint.

Image Decode
Three of the four carousel background images are 1400 x 1020, while the last one is 4000 x 2662!! Woah man that’s huge. The larger the image, or rather in this case as it’s full screen, the larger the image, the more work it takes to decode it. Also of relevance, that huge image has to be resized to fit my screen, so there’s no point in serving an image that large. (I can’t seem to nail down, whether this image is resized everytime it’s shown or if that resize gets cached.)
Image Sliding
The bulk of work, besides decoding, is from how the images are being slid. The relevant code for the images being slid is here.
function animate(width) { var curr = c === -1 ? c = slidesN - 1 : c = c %
slidesN; $($slider).stop().animate({left: -(width * c)}, 1200); }
Jquery is the heart of this code, as it is on like a bajillion other sites. The
first line of the function seems like it doesn’t do much, because curr isn’t
used anywhere else. Using the animate function here explains the timer fired
that keeps showing up in the timeline. Let’s try some things to see if we can
make this part faster. (Just found out you can’t live edit JS when it’s pretty
printed, unless I’m doing it wrong. So saved a local copy and working from
that)
Try 1
$($slider).css({ '-webkit-transition' : '-webkit-transform 1s ease' });

function animate(width) {
  $($slider).css({ '-webkit-transform':'translateX('+ -(width * c) +'px)', });
}
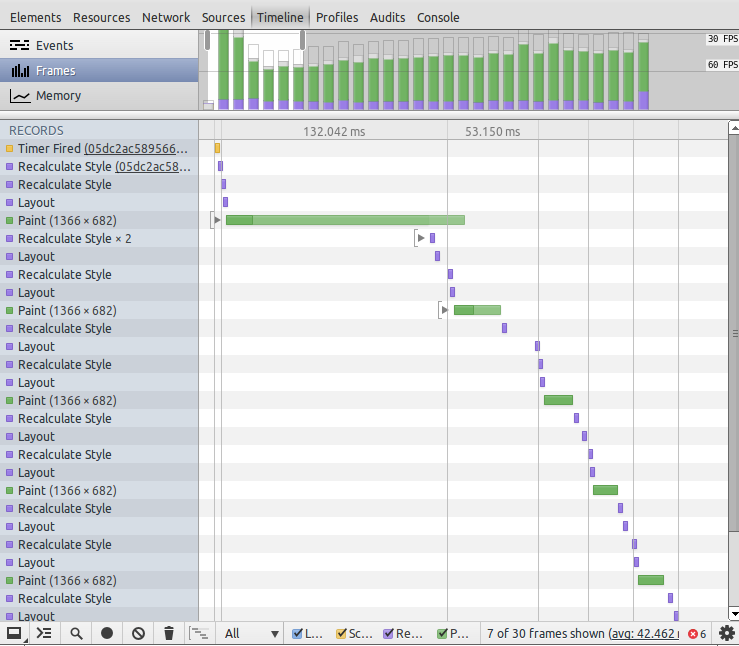
Were getting somewhere, paint times are now between 30 and 60 FPS instead of under 30 FPS. This gets rid of jQuery.animate, uses translateX instead of position left, and animates using a CSS transition which has a host of performance benefits. More explanation on animating left vs translate can be read about here.
Try 2
$($slider).css({ '-webkit-transition' : '-webkit-transform 1s ease' });

function animate(width) {
  $($slider).css({ '-webkit-transform':'translate3d('+ -(width * c) +'px, 0, 0)' });
}
This again uses a CSS transition, but now uses a 3d translate to move it left and up… 0? Why would we want to move it up 0 amount? This will (usually) cause Chrome (or other webkit browsers) to place it in its own layer and use the GPU and yadda yadda. Read more here. Anyhow, it still isn’t hitting the 60 FPS mark!
Try 3
Third times a charm!
<div class="slide">
  <img src="reelrocktour.com_files/one.jpg" alt="" width="1400">
  ...
</div>
.slide {
position: relative;
height: 100%;
width: 100%;
overflow: hidden;
float:left;
}
.slide > img {
position: absolute;
z-index: -1;
}So originally, each image was a background-image applied with CSS. Turns out
that was the culprit. Changing the markup to include the image as an actual
image allowed us to hit 60 FPS. The img is taken out of flow with absolute
positioning and overflow is hidden for proper sizing. I suspect the browser can
handle img tags much better than background-image styles because the image
decoding seemed to disappear from the timeline. (Note: I did also resize that
gigantic image to be width 1400). Also there are no image resizes to happen in
this case because all images are 1400px wide and never have to be resized.
Conclusions
There are a ton of jQuery animations on this page and a lot of
them are pretty smooth, so its not totally the culprit. It would take some more
investigation to figure out whether a jQuery animation would have worked fine
with the change in markup, but why do that when you can do CSS animations! In
addition, the translate3d trick did not have a significant impact in the end.
I’m curious to know more about the performance of background-image and why it
doesn’t work in this situation. In hindsight, the huge image decode times
should have lead me to go straight to pthe third solution, but oh well.
Huge inspiration from these two great videos, totally worth your while. And free time with two casts on my hands.